Math
Show and share my survey
I can make a graph and tell what it shows.
Standards: 1.MD.C.4
- Number practice (no timer)
- Mixed facts within 20 (keep-up practice)
- Builds on
- Day 1 (collecting survey data) and Week 29 (bar graphs). One-minute check: "How many people answered your survey?" (Answers vary. Look for: the total of the tally marks.)
New words
- fact: something that is true; a graph fact is something true that the graph shows
- present: show and tell your work to other people
You need
- Grid paper, or a grid an adult draws in the notebook: 3 columns of 10 boxes, each box about the size of a thumbnail, with the numbers 1 to 10 written up the left side
- Crayons
- The survey tally chart from Day 1
- Notebook and pencil
Warm-Up · 5 min
Fluency: mixed facts within 20, any strategy. "8 + 5?" (13) "12 - 9?" (3) "6 + 7?" (13) Spaced review from Week 20: "40 + 30?" (70)
Mini-Lesson · 10 min
Model with a sample survey. Draw a tally chart: "Which do you like best: pancakes, waffles or cereal?" Pancakes 4, Waffles 2, Cereal 3. Make a bar graph on a grid while your child watches: title, labels, then color one box per vote from the bottom. Then say 3 graph facts, writing each one: 1) "Pancakes got the most votes." 2) "9 people answered." 3) "Pancakes got 2 more votes than waffles." Say: "A good graph report has one fact about the most or the fewest, one fact about how many in all, and one fact about how many more or fewer."
Guided Practice · 10 min
Your child makes a bar graph of the survey from Day 1, with a title, 3 labels and one box per tally mark. Answers vary. Look for: each bar the same number of boxes as its tally, colored from the bottom with no skipped boxes. Then your child writes or tells 3 facts using the frames: "___ got the most votes." "___ people answered." "___ got ___ more votes than ___." If stuck, say: "Count the tally marks in one row. Color that many boxes in that bar, starting at the bottom."
Play · 10 min
Data Report. Your child presents the survey to the family: reads the question, shows the graph and says the 3 facts. Each listener asks one question about the graph, and your child answers it from the graph. Answers vary. Look for: facts that match the graph. Write your child's 3 facts under the graph and keep it.
Exit Ticket · 3-5 min
Before asking, draw a bar graph titled Pet We Want with 3 bars: Bunny 5, Bird 2, Turtle 4. Read each question aloud. Your child answers out loud. Check each answer together right away.
Exit ticket
- How many people answered this survey?
- How many more people chose bunny than bird?
- Tell me one more true fact about this graph.
Answers
- 11
- 3
- Answers vary. Look for: a true fact, such as "Bird got the fewest votes" or "4 people chose turtle."
Watch for, and help or stretch
- Watch for
- Saying a fact that the graph does not show, such as why people chose an answer.
- Try
- Ask: "Can you point to that on the graph?" If not, it is not a graph fact.
- Extra help
- Your child says the 3 facts out loud while you write them. Use cube towers to find the "how many more" fact.
- Stretch
- Your child writes a fourth fact using "fewer," such as "Waffles got 1 fewer vote than cereal."
At home (optional): Your child shows the survey graph to a relative or friend and tells the 3 facts.
 What time is it?
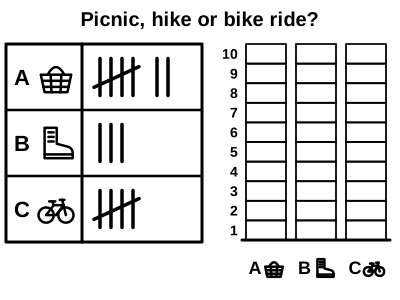 Color one box for each tally mark.