Math
Year review: data
I can make a graph and answer questions.
Standards: 1.MD.C.4
- Number practice (no timer)
- Facts within 10 (keep-up practice)
- Builds on
- Unit 5 (Weeks 29 and 30: tallies, bar graphs and asking questions about data). One-minute check: draw a bundle of 5 tally marks and 3 more. "How many?" (8)
New words
- survey: asking people a question and writing down their answers
You need
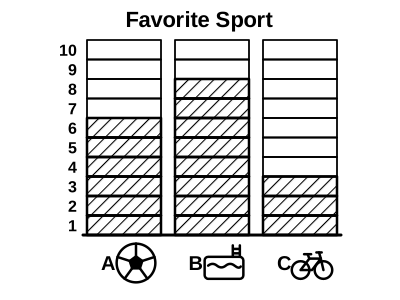
- Grid paper, or a grid an adult draws in the notebook: 3 columns of 10 boxes, each box about the size of a thumbnail, with the numbers 1 to 10 written up the left side
- Crayons
- Notebook and pencil
- 20 linking cubes (for checking compare questions)
- Cubes are small parts: keep them away from children under 3.
Warm-Up · 5 min
Fluency: facts within 10. "3 + 7?" (10) "10 - 8?" (2) Spaced review from Week 31: "What makes a square a special rectangle?" (All 4 sides are the same length.)
Mini-Lesson · 10 min
Say: "Let's finish the year with a survey about math!" Write the question: "Which math did you like best this year: shapes, clocks or adding?" Draw a tally chart with 3 rows. Model the first 2 votes: ask a family member and make the tally mark, then vote yourself. Your child votes too. Say: "Who else can we ask?" Your child asks everyone at home, and calls a relative if possible, making one mark per person.
Guided Practice · 10 min
Your child makes a bar graph of the survey on the grid, with a title and 3 labels, coloring one box per vote. Then your child answers: "How many people answered?" "Which got the most votes?" "How many more chose ___ than ___?" Answers vary. If fewer than 5 people answered, use this sample data instead: shapes 5, clocks 3, adding 6. Sample answers: 14 people; adding got the most; 3 more chose adding than clocks; 1 fewer chose shapes than adding. If stuck, say: "Build cube towers for the two bars. Line up the bottoms and count the extra."
Play · 10 min
Graph Questions Swap. Draw a second bar graph: How We Got to the Library. Walk 9, Bus 4, Car 6. Ask your child: "How many in all?" (19) "How many more walked than took the bus?" (5) "How many fewer came by car than walked?" (3) Then your child asks you 3 questions about the math survey graph and checks your answers.
Exit Ticket · 3-5 min
Before asking, draw a tally chart titled Fruit Snack: Berries 7 (a bundle of 5 and 2 more), Melon 2, Oranges 5 (a bundle of 5). Read each question aloud. Your child answers out loud. Check each answer together right away.
Exit ticket
- How many people chose oranges?
- How many people answered in all?
- How many more people chose berries than melon?
Answers
- 5
- 14
- 5
Watch for, and help or stretch
- Watch for
- Adding the two numbers when the question asks how many more.
- Try
- Ask: "Is the question asking for all of them, or for the extra?" Build two towers and count only the extra cubes.
- Extra help
- Use the sample data and make the bar graph together, counting each box out loud.
- Stretch
- Ask: "How many more votes would clocks need to tie with adding?" (Sample data: 3)
At home (optional): Your child shows the math survey graph to a family member and tells 2 facts about it.
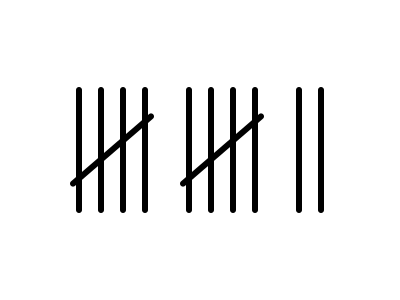 How many? ____
 Circle the bag for a good or the hand for a service.
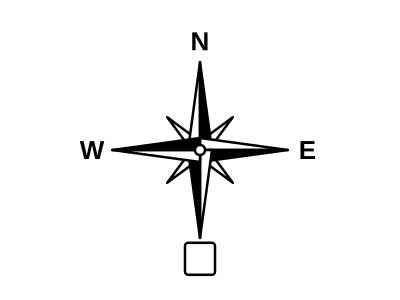 Which letter goes in the box?