Math
Picture graphs
I can make a picture graph from my tally chart.
Standards: 1.MD.C.4
- Number practice (no timer)
- Count tallies by 1s (and 5s as a shortcut)
- Builds on
- Day 1 (tally charts). One-minute check: draw a bundle of 5 tally marks and 1 more. "How many?" (6)
New words
- picture graph: a graph that uses one picture for each answer
- title: the name at the top of a graph that tells what it is about
- label: a word that names each category on a graph
You need
- About 40 sticky notes, all the same size (or 40 paper squares and tape). The pet graph (15 notes) and the Family Fruit Survey graph stay up for Day 4, and the Graph Detective graph needs 13 more.
- The Family Fruit Survey tally chart from Day 1
- The pet tally chart from Day 1
- Notebook and pencil
- Crayons
Warm-Up · 5 min
Fluency: count tallies. Draw 2 bundles of 5. "How many?" (10: 5, 10) Draw 1 bundle and 4 marks. (9) Spaced review from Week 3: "There are 7 apples and 4 pears. How many more apples than pears?" (3)
Mini-Lesson · 10 min
Say: "A tally chart helps us count. A picture graph helps us see the data fast." Use the pet tally from Day 1 (dog 7, cat 5, fish 3). On a table or a wall, write the title Our Favorite Pets. Put 3 labels in a row along the bottom: Dog, Cat, Fish. Your child draws a little face on a sticky note for each vote and sticks the notes in a straight column above the right label, one on top of the other, with no gaps. Say: "Each sticky note stands for one vote. The notes are all the same size and touch, so we can compare the columns." Ask: "Which column is tallest?" (Dog) "How many notes in the cat column?" (5) "How many fewer notes for fish than for cat?" (2)
Guided Practice · 10 min
Your child makes a picture graph of the Family Fruit Survey from Day 1, with a title, 3 labels and one sticky note per vote. Answers vary. Look for: the same number of notes as tally marks in each row, straight columns with no gaps, a title and labels. Ask: "Which fruit got the most votes? The fewest?" (Answers vary.) If your family survey is very small, use the Day 1 lesson data instead: apple 6, banana 4, grapes 3. If stuck, say: "Point to one tally mark, then stick one note. Point to the next mark, then the next note."
Play · 10 min
Graph Detective. While your child looks away, make a picture graph of the fruit lesson data (apple 6, banana 4, grapes 3) with 2 mistakes: leave a big gap in the middle of the banana column so it looks taller than apple, and leave off the title. Your child finds and fixes both mistakes. (The banana notes must touch; the graph needs a title.) Then your child makes a mistake in a graph for you to find.
Exit Ticket · 3-5 min
Before asking, draw a small picture graph in the notebook titled Snacks We Like, with one circle per vote: Crackers 4 circles, Yogurt 2 circles, Apples 5 circles, in straight rows. Read each question aloud. Your child answers out loud. Check each answer together right away.
Exit ticket
- How many people chose yogurt?
- Which snack got the most votes?
- What does each circle stand for?
Answers
- 2
- Apples
- One vote, or one person's choice.
Watch for, and help or stretch
- Watch for
- Sticking notes with uneven gaps, so a shorter column looks taller.
- Try
- Slide the notes so each one touches the one below it. Then compare the tops of the columns again.
- Extra help
- Do the fruit graph together, one row at a time. Count the notes aloud as each one goes up.
- Stretch
- Ask about the pet graph: "If 2 more people chose fish, would fish still have fewer votes than cat?" (No. Fish would have 5, the same as cat.)
At home (optional): Your child shows the picture graph to a family member and tells which fruit got the most votes.
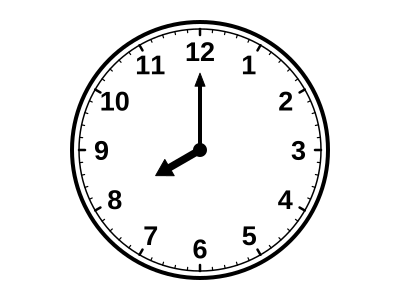 What time is it?
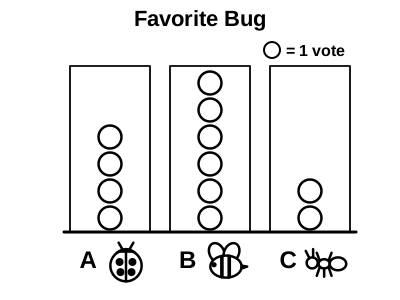 How many chose the bee? ____
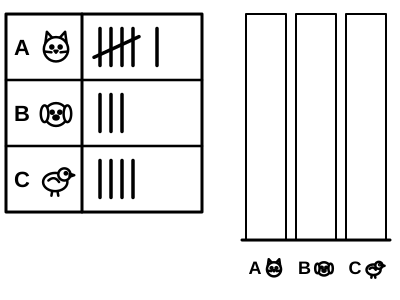 Draw one circle for each tally mark.